Performance monitoring is the process of using various tips, utilities, and performance monitoring tools that allow identifying possible bottlenecks in a given configuration.
When performance problems are experienced on a system, it is necessary to distinguish problems due to the UNIX environment and problems due to a configuration not adapted to the application.
The reader is assumed to have a fairly good understanding of a D3 environment and some knowledge of UNIX.
UNIX related performance problems are usually punctual: at one given time, the system performances degrade noticeably, but overall performance should remain satisfactory. These problems are usually fairly easy to track and to fix.
Configuration problems can be more troublesome, as they can occur repetitively under some circumstances. The basic principle is to monitor the activity of the system over a long period of time during normal system activity. A series of statistics are taken and stored in a log file for later analysis.
The command to monitor the activity is buffers. The command to display the log file is buffers.g.
First, review the results provided by SAR to eliminate configuration problems due to an unexpected UNIX activity alongside with the D3 activity. Device related problems can also have very visible effects on the overall performance.
See the topic System Activity Reporting in the System Administration section of the UNIX Installation or User’s Guide for more information on SAR.
A well-balanced system should have a high percentage (above 80-90%) of user CPU usage. High system mode usage indicates too many process switches, or too many system calls. A nonnull waiting for I/O CPU usage indicates disk bottleneck. If the system CPU usage becomes very high, without high I/O activity, this may indicate a device problem (see below).
The absolute golden rule is to avoid swapping (paging) during normal operations. To avoid swapping, the physical memory must be increased, or the amount of memory allocated to D3 decreased. Surprisingly, if the system swaps, D3 performances may improve by reducing the amount of memory allocated to D3 in the configuration file. Obviously, there are some lower limits that should not be crossed. The D3 activity monitoring allows determining how low you can go.
If possible, avoid using costly UNIX commands during peak hours (compiling is time-consuming, X-window requires a lot of memory, and so on).
If some significant swapping is taking place, verify that the memory allocated to D3 is not bigger than the total amount of physical memory minus the minimum size of memory required for the UNIX Kernel (from 2 MB for Linux to 6 MB for AIX, depending on the implementation).
To identify which processes are running, do the following (as root):
ps -edalf | grep R S UID PID PPID STIME TTY TIME CMD R root 4719 1 ... 07:08:53 24/0 0:05 d3 - 24 tty24 R root 8999 10534 ... 07:58:33 89/0 0:00 ps -edalf S root 10534 4133 ... 08:58:33 89/0 0:00 grep R R demo 26242 25467 ... 07:10:03 75/0 0:16 demo |
The above example shows an extract of the result. This shows that the process 4719 runs D3 on the PIB 24. The process 26242 is a non-D3 process that has used three times as much CPU as the D3 process did. By running this command several times, if some processes show several times, it will be possible to identify processes that should not be running during peak hours.
The most common problems with TTYs are due to incorrect cabling. When UNIX tries to spawn a process (D3 or UNIX) attached to a terminal, the device must be ready. If not, UNIX waits a bit and tries again. Worse, a port with a DCD in an unstable state can generate many interrupts, which, in turn, generate hangup signals, creating a very important system load. To identify such problem, do the following (as root):
ps -edalf | grep ’?’ S root 4184 9047 ... 09:06:26 89/0 0:00 grep ? S root 25185 1 ... 07:08:52 ? 0:00 d3 - 9 tty9 R root 30571 1 ... 07:08:52 ? 23:45 d3 - 19 tty19 printer |
This command shows the process attached to terminals the system could not open. In the above example, the second line shows a D3 process (PID=25185) in a sleeping state (S). This process does not consume any CPU. The system could not open the terminal /dev/tty9, and abandoned trying to open it. The third line shows a D3 process (PID=30571) in a running state (R). This terminal does use CPU, as the CPU usage 23:45 shows. The system tried to open the device /dev/tty19 and failed. Most likely, the cable is incorrect or hanging loose at the other end, and is generating constant signals.
To fix this situation, the terminal must be connected properly or the associated entry in /etc/inittab turned to off instead of respawn. Unfortunately, it is sometimes very difficult to identify which device is in trouble when the above command does not show it explicitly. Only carefully checking the cables or trying to find the ports that did not start as expected, will allow you to find the faulty port.
The following elements are monitored by the buffers command:
Name |
Description |
Activ |
Number of Process activations. Each disk read, keystroke, or process wake up after a sleep increments this counter. When the number of frame faults is subtracted from this counter, this gives an idea of the volume of data entry. |
Idle |
Idle time. Not supported on UNIX implementations |
Fflt |
Frame faults. Counts the number of disk reads. |
Writes |
Disk Writes. All writes are normally done by the background flush process to update disk from dirty frames in memory. A high number indicates either a lot of updates or an insufficient memory allocation for the D3 virtual machine. |
Bfail |
Buffer Search Failures. Counts the number of failures to allocate a buffer in memory for a new frame. When nonzero, this indicates that the memory is insufficient. This counter should never be nonzero. |
RqFull |
For Windows: Disk Read Queue Full. For UNIX: Not supported. |
WqFull |
Disk Write Queue Full. Counts the number of instances where the flusher cannot keep up with the dirtying of frames. This is an indication that either the write queue is too small for the given configuration or that the memory is too small. |
DskErr |
Disk Errors. |
Elapsd |
Elapsed time. Time in seconds between two samplings. For internal use only. |
DblSrc |
Double Search. Counts the number of collisions between two or more processes frame faulting on the same frame at the same instant. A nonzero counter should be exceptional. |
Breuse |
Buffer Reuse. Counts the number of instances where a memory buffer has been allocated by one process to read one FID and another process allocated the same buffer to contain another FID. A nonzero counter should be exceptional. |
Bcolls |
Batch Contentions/Collisions. Counts the number of collisions between a batch process (a process that is disk intensive) and an interactive process (a process that is keyboard input intensive). By default, D3 ensures that interactive processes are given priority over batch processes in accessing certain resources. |
Sem |
Semaphores Collisions. Counts the number of collisions between two processes trying to access a system-wide internal table. |
Vlocks |
Virtual Locks Failures. Counts the number of cases when a D3 process tried to assert a virtual lock and failed to acquire it because another process had it. |
Blocks |
FlashBASIC Locks Failures. Counts the number of cases when a D3 process tried to assert a FlashBASIC lock and failed to acquire it because another process had it. |
B0reg |
Buffers with no Virtual Registers attached. Buffers not currently attached for immediate reference. At any given time, very few buffers are actually attached. It is therefore normal that this number be almost equal to the total buffers in memory. |
B1reg |
Buffers used by more than one process, but not used by its owner any more. These should be in very small number. |
B2reg |
Buffers used exclusively by their owner. On RISC implementations, this situation allows better performance, because there is no conflict on these buffers. Normally, these buffers contain private workspace, data that is not shared, and so on. |
B>3reg |
Buffers used both by their owner and other processes. This number represent the number of pages actually shared among processes (data files) at any given time. |
ww |
Write Required. Counts the number of buffers currently modified and not yet written to disk. |
IObusy |
Buffers being read from disk. Counts the number of pending disk reads. This counters is usually null, since reads are too fast to be picked up. |
Mlock |
Number of buffers memory locked. If the ABS section is locked, this number is at least equal to the ABS size. Also included, are the tape buffers when the tape is attached. |
Ref |
Referenced Buffers. Number of buffers that have been recently used. |
WQ |
Write Queued. Number of buffers currently enqueued for write. |
Tophsh |
Top of Hash. Measures the quality of the hashing algorithm used to find a frame in memory. This number must be high (above 60% of the total buffers). |
avail |
Available buffers. Number of buffers candidate for replacement. These are the buffers that nobody has been using recently. When this number drops below 10% of the total buffers, performance decreases significantly. |
batch |
Batch Buffers. Number of buffers used by batch processes. A high level (something approaching 50% of disk buffers) indicates that disk intensive activity is taking place by batch processes. |
The activity log is stored in the file buffers.log with a data level per weekday (buffer.log,Monday, buffer.log,Tuesday, and so on). The file is created automatically when the buffers (H command is used for the first time. Each data level is cleared when changing day, so that the file records a whole week of activity automatically. The item-ID is the internal time on five digits.
The buffers command also creates automatically the dictionary attributes corresponding to the various counters, as shown in the table above. The attribute TIME displays the sampling time.
The attribute DESCRIPTION in the D-pointers Monday, Tuesday and so on contains the date.
The file is created with a DX attribute.
Log on to the dm account. Type:
buffers {(options} |
options |
are as shown below: |
|
C |
Clears today’s log data level when used with the H option. This option must be used the very first time. To restart the monitoring after having stopped it, do not use the C option. |
|
H{n} |
Records statistics in the log file. If followed by a number n, the process sleeps n seconds between each sample. The default value is 5 seconds. When sampling over long periods, 5 minutes (300 seconds) is a good compromise between accuracy and volume of data. |
|
L{n} |
Loops sampling and displays statistics. If followed by a number n, the process sleeps n seconds between each sample. The default value is 5 seconds. |
|
S |
Displays system counters. Without this option, a simplified set of counters displays. All counters are always recorded, even without this option. |
|
Example(s)
This takes one sample of the nonsystem statistics.
buffers |
Loops and displays all counters, recording history and sampling every 300 seconds (5mn). The log file data level corresponding to today is cleared, thus starting a new session.
buffers (SH300C |
When looping, buffers polls the keyboard to detect the key X to stop or R to redraw the screen if it has been disturbed by a message, for instance. Any other key forces buffers to take another sample.
Raw display
The history file can be displayed with any AQL sentence. For example:
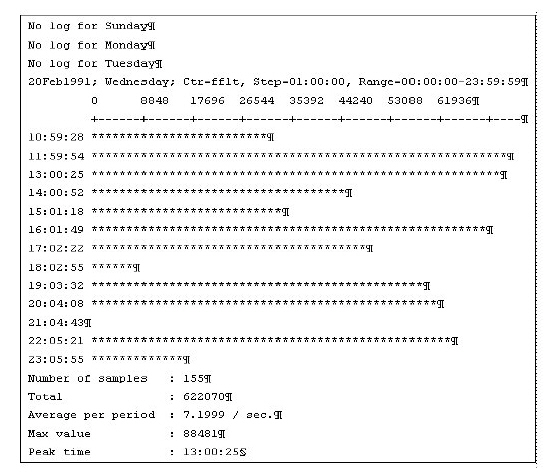
sort buffers.log,friday with time >= "11:14:00" |
Histograms
The buffers.g command lists the log file as a series of histograms.
buffers.g cntr [day{-{day}}|*] {step {strt.time-{end.time}}} {(options} |
cntr |
Statistic counter name (for example, fflt for the third counter). Must be among the list shown in the table above. If the counter specified is relative to the buffers, percentages of the total buffers are displayed, rather than raw figures. |
|
day |
Days to list. The day can be one day, expressed either explicitly (Monday, Tuesday, and so on) or a number from 1 (Sunday) to 7 (Saturday). A range of days can be specified by specifying two days separated by a dash (-). If the second day is omitted, Saturday is assumed. The whole week can be listed by using an asterisk (*). |
|
step |
Specifies the display time step as HH:MM{:SS}. All samples taken within the step are accumulated and averaged. If step is not specified or if the step is 0, or if the step is smaller than the sampling period in the log file, all samples are displayed. |
|
strt.time |
Starting time. If no starting time is specified, 00:00:00 is assumed. |
|
end.time |
Ending time. If no ending time is specified, 23:59:59 is assumed. |
|
options |
P |
Directs output to printer. |
Example(s)
This lists the number of frames faults (disk reads), for the whole week, by step of one hour. In the example below, no history was recorded before Wednesday.
buffers.g fflt * 01:00:00 |
This lists the percentage of write-required buffers, for the week days only, during business hours, by steps of 30 minutes.
buffers.g ww monday-friday 00:30 08:00-17:30 (p |
After taking a significant sample, list the results with the buffers.g command. The most useful parameters to survey are:
Fflt |
Measures the number of frame faults. If this number approaches the disk bandwidth as determined by the manufacturer, the system becomes disk bound. Solutions range from increasing the memory allocated to D3, to changing disks, or reorganizing the D3 database on separate disks to increase parallelism. |
Writes |
Should be about one-third to one-half of the number of frame faults. It is not normal for a system to do more writes than it reads, under normal operation. If this is not the case, see Flusher Adjustment. |
Bfail |
Number is never nonzero. If it is nonzero, the memory allocated to D3 is definitely too small. |
WqFull |
Number is rarely nonzero. If it is nonzero, and if the number of writes is too large, there is an abnormal rate of writes. |
Bcolls |
A number that is too large indicates that a lot of batch jobs (such as selects on large files) are done while other processes are performing data entry, and that interactive jobs are receiving higher priority than batch processes. |
ww |
Number should be more than 50% of the whole buffer pool. If this is the case, the flusher is probably not activated often enough. |
avail |
Number should never be less than 10% of the whole buffer pool. If this is the case, memory must be increased or the flusher must be adjusted. |
The flusher is a background process, started automatically at boot time, that scans the D3 memory and writes back to disk frames that have been modified. It is an important task, not only to ensure that data gets back on disk, but also to make room for new data. Usually, a process reads data, modifies it, but may not need it for a long time. The flusher takes care of writing the data back on disk so that the memory can be reused to read in other data.
This cleaning of the memory is done:
Periodically. If the disk is inactive for some time, the flusher wakes up and scans the memory, writing back all it can unless another a process requires a disk access. This period is defined by the flush statement in the configuration file.
On demand. When the memory gets full, that is, when a lot of pages in memory have to be written back to disk, the flusher wakes up immediately.
The more times the flusher gets awakened, the more times memory is written back to disk. But this creates disk activity, thus decreasing the disk channel bandwidth available for useful work, and CPU activity, therefore adding system load. Another catch to a high frequency flush is that data that is being modified (workspace, select lists, and so on) may be written several times on disk when only the last time would have been necessary.
The command set-flush allows changing the flush period. Increase this period, checking with buffers that the write queue full events remains low and that the number of available buffers does not drop too low. Normally, the system is self-regulating, increasing the flush frequency in case of high memory usage, so there is no need for a low flush period. Thirty seconds should be the high limit.
The configuration file also contains the dwqnum statement, which defines the length of the internal write queue. Increasing this queue reduces the probability of the situation in which the flusher awakened on critical demand, thus reducing the number of flushes. The downside to increasing the write queue size is that the flusher works by bursts, which can overload the disk channel when this phenomenon occurs. This parameter cannot be changed dynamically, which makes a bit more difficult to monitor.
D3 user processes are divided into two activity type classes:
Interactive processes are processes that typically do keyboard inputs frequently.
Batch processes have little keyboard activity, require a lot of disk I/O, and/or are CPU intensive.
The system automatically discerns which type of process is running based on internal statistics.
The System Administrator can bias and/or override the default parameters used by the prioritization mechanism. Though not recommended, one can even force any process, regardless of its process activity, to be seen by the system as interactive, for example. This can be changed dynamically on a per process basis via the set-batch command Also, the TCL command set-batchdly allows the displaying and setting of global values used in the queueing of certain types of process activity.
See Also
buffers Command, set-batch Command, set-batchdly Command, syschk Command, what Command