Uniface Debugger
The Uniface Debugger is a Uniface application that can connect to a local or remote Uniface application process so that you can conduct step-by-step, real time analysis of the executing ProcScript. It enables you to find and correct ProcScript errors, investigate application behavior, and improve code in all types of Uniface application.
You can interactively step through ProcScript, trace I/O and ProcScript execution, browse ProcScript modules, set watches on expressions, and set breakpoints. You can view and influence the execution of ProcScript code and inspect or change data values to:
- Locate logical programming errors
- Investigate application behavior and follow invocations
- Optimize a component by locating inefficient or inappropriate code
Debugger Main Window
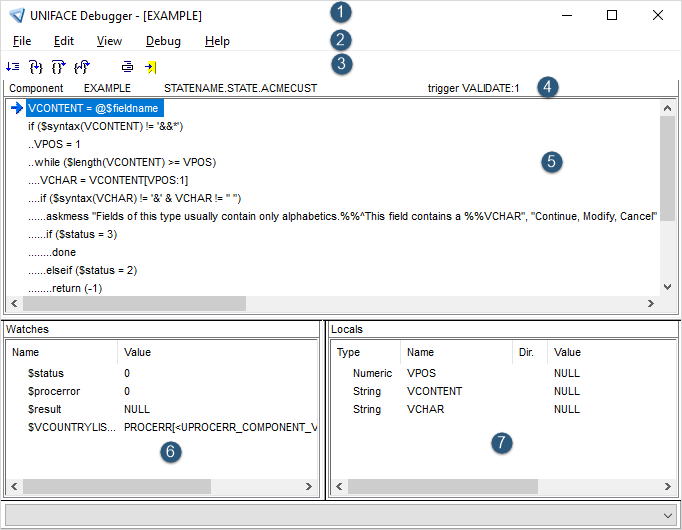
Uniface Debugger: Main Window

The main window of the Uniface Debugger consists of the following areas:
- Title bar—name of the object being debugged.
- Menu bar—provides access to various controls, dialogs, and settings of the Debugger.
- Tool bar—buttons for stepping through the code, going into, out of, and over script modules, as well as setting breakpoints and watches.
- Context bar—displays the current component, object, script module, and line number being executed.
- Module panel—shows the ProcScript module being executed, highlighting the next line to be executed.
- Watches panel—displays the values of fields, variables, expressions, and ProcScript functions that you have selected to watch, including the default watches $status (last return condition set), $procerror (reason for the last error), and $return (value set by specific ProcScript statements). Watches are automatically updated as code is executed.
- Locals—displays the name and value of all operation and entry parameters, and of any active local variables, within the scope of the current ProcScript module.
Note: The Debugger is a left-to-right application only. If you attempt
to run it in right-to-left mode (with a setting in your .asn file for
$RTL_APPLICATION), the Debugger windows will not display correctly.
